CprE 488 - Embedded
Systems Design
MP-4: UAV Control (ver. 2.0)
Assigned: Monday
of Week 10 Due:
Monday of Week 12 Points: 100 +
bonus points
Note: the goal of this Machine
Problem is for you to work with your group to increase
your exposure to three different aspects of embedded system design:
1.
Implementing Embedded Control
— you will learn to implement control
theory into a discrete system capable of running on a
microcontroller.
2.
Understanding PID Control
Basics — you will tune PID loops to gain familiarity with the impact of
different values.
3. Debugging over telemetry
— you will learn to debug systems
using parameter logging over wireless communication.
Your Mission
A
MAN HAS FALLEN INTO THE RIVER IN LEGO CITY! Start the new rescue
quadcopter! HEY! Program and tune the quadcopter, and off to the rescue!
Prepare the lifeline,
lower the stretcher, and make
the rescue! The Crazyflie collection from MicroCART!
Say hello to your Crazyflie drone! The goal at the end of this lab is to be able to smoothly control the Crazyflie
with the algorithms that you will write and test. First, we will give you a
brief overview of the Crazyflie system and how to set
up the development environment for this lab.
This lab has been
developed over the course of several years by the MicroCart
Senior Design project. The MicroCart Youtube Channel has many videos you may find helpful in case you get
stuck during this lab, or for ideas you can do for extra credit.
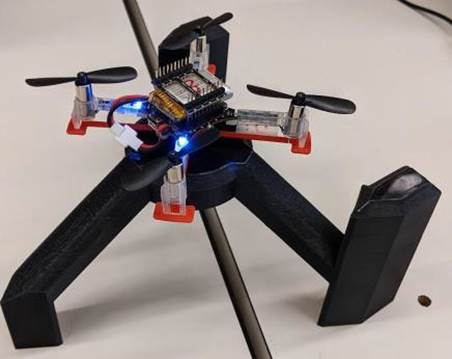
Part 0: Meet the Crazyflie.
There is only one physical button on the Crazyflie, the power button. To start the Crazyflie:
1.
Plug in a charged
battery
2.
 Press the power button
located near the front
right arm of the drone
Press the power button
located near the front
right arm of the drone
3.
Wait for all four props to do a short spin and the startup tone to play.
4.
Place the Crazyflie on a flat surface to allow its sensors to calibrate.
This is indicated by the flashing red LED. If it flashes quickly, then the
sensors have been calibrated properly and the drone is ready to fly. If the LED
flashes slowly, then the sensors have not been calibrated yet. If some hardware
is damaged on the Crazyflie it may fail to pass its self check on startup. This is indicated by the red led flashing
quickly 5 times. In this case the hardware may be inoperable. If this is the case, notify a TA or the
instructor.
5.
Always secure the CrazyFlie to a test-stand
during PID tuning, and Controller development
Figure 1. Crazyflie top down diagram
|
LED Lights
|
Diagnostic
|
|
flashing red LED
|
Calibrating
|
|
Slow flashing LED
|
Sensors have not been calibrated
|
|
Red LED flashing 5 times quickly
|
Failed to pass self checkup. Talk to TA if this happens
|
Crazyflie System
Overview
This is the complete
Crazyflie control system. You will only be modifying a small portion
of it, but it will be helpful to understand the full scope of the
system you are interfacing with.
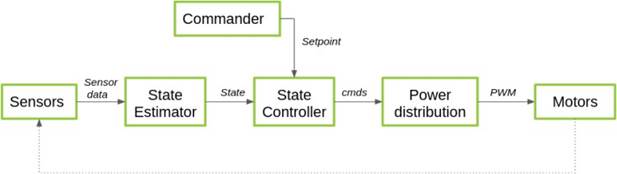
Figure 2. Crazyflie control diagram
The control
process starts with the state estimator module receiving sensor data and using it to
calculate the drone's current attitude (its rotation, i.e. roll, pitch, and
yaw). The state estimator then sends the calculated attitude
to the state controller module,
which also receives
a setpoint from the commander
module (in our case, this is user input specifying the desired attitude or
attitude rate and thrust). The state controller module contains a cascading PID
controller that uses the inputs from the state estimator to calculate the
actuation force needed. That is then sent to the power distribution module
where the actuation force is converted to motor power then the loop starts over
again.
You will be implementing the State Controller’s cascading PID in part 2 of this lab.
Figure 3. Cascading PID diagram
The Crazyflie runs off of a cascaded
PID system where the output of the first PID controller is then used as an input for a second
PID controller. This layout can be seen in figure
3, the output from the attitude PID controller, the desired attitude
rate, becomes the input of the attitude rate PID controller. In part 2, you
will be implementing the attitude and attitude rate PID controllers for roll,
pitch, and yaw. In part 1, you will be determining the PID values that should
be present in the controllers by using a working PID controller before
implementing it yourself.
Crazyflie Connection Setup Guide
The tools needed to flash, interact
with, and fly the crazyflie have been packaged
into a virtual image for your convenience.
Step 1: Open the Virtual Machine.
The virtual
machine has been configured to have the necessary utilities to develop the Crazyflie firmware. Below are detailed instructions for
completing different tasks within the virtual machine. Login username is bitcraze and password is crazyflie. Add the VM Image from
the C:/Temp/MP4Image/BaseFolder folder. To do this you click
the big green plus button
to add VM Image and not the “Import” button. If you would like more
information about the VM or to download the VM on your personal computer see Appendix
B. The virtual machine is
immutable, which means that if you
do not save any files you change elsewhere
they will be reset on startup. For
this reason it is recommended that you use git or
Google Drive or a shared folder to save work. This is more important for Part 2 but is still
worth mentioning now.
Step 2: Flashing the Crazyflie.
It is possible that another version
of the quad software is currently flashed
onto the crazyflie. In order to
ensure that the Lab_Part_1 version of the software is installed, follow these
steps.
1.
Navigate to the Crazyflie firmware folder,
ex:
‘~/Desktop/Lab_Part_1/crazyflie_software/crazyflie-firmware-2021.06/’
2.
Plug in the Crazyradio into the usb port
3.
In the bottom
right corner of the VM there is a USB icon, make sure the Bitcraze Crazyradio is selected
under this menu
a. The menu is accessed
by right clicking
the icon. Clicking
on a device places a checkmark signifying it is mapped to the VM
b.
This can be finicky, may have to physically reconnect the radio a couple
of times for it to connect successfully to the VM
Note: You can also add the USB by going to:
a.
Open Oracle VM VirtualBox Manager
b.
Click on Settings
c.
Click on USB
d.
make sure the Bitcraze Crazyradio is selected
under this menu
4.
Create the file ‘crazyflie_software/crazyflie-firmware-
2021.06/tools/make/config.mk’ if it doesn’t already exist and open with VS code
5. Add CLOAD_CMDS=-w radio://0/<radio_channel>/2M/E7E7E7E7E7 to the file
and replace <radio_channel> with your Crazyflie’s radio channel
a.
Your radio channel
can be found in this spreadsheet
Crazyflie Radio Map
which is mapped to the drone number
located on the bottom of the drone.
b.
This is a one time
process and should not have to be done for any subsequent flashes
unless you change which drone you are using or what folder you are flashing from
6.
Make sure the Crazyflie is powered
on and running
7.
ONLY for Part 2 of the lab, compile the Crazyflie firmware with make
CONTROLLER="Student" from the root of the Crazyflie firmware
before proceeding.
8.
Run make cload from the ‘/crazyflie-firmware-2021.06/’ firmware folder
to begin flashing the
compiled firmware to the Crazyflie specified earlier.
Step 3: Setting up the test stand
With the drone
flashed, we are almost ready to begin tuning the PID values, however we first
want to ensure that the drone is secured about whatever axis we will be tuning the rotation
for. The test stand is used to secure the drone about an axis of
rotation and to also measure the rate of rotation and exact position of the
drone.
Step 3a: Test Stand Components
The test stand for MP-4 is a bit more complex
than the ones used in MP-1, and consists of three
major components, plus a couple wires to connect them. The test stand base
holds the rotary encoder used to measure position, and can be used in two
different configurations depending on
the drone orientation needed.
The test stand
mount attaches to the encoder shaft, and holds the Crazyflie
drone in place through friction. There are two different mounts,
which can hold the drone in either
a horizontal or vertical
position.
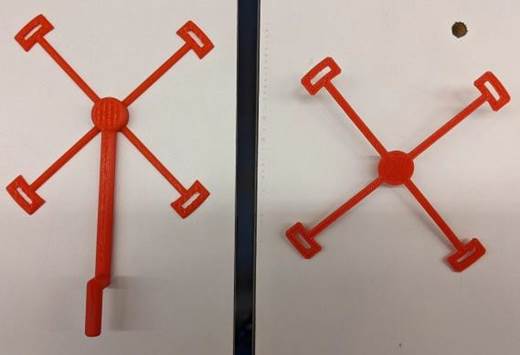
Figure 4: Drone Holders
Step 3b: Secure
Drone
Before starting
the ground station,
secure the drone to a mount.
If you would like more information about the test stand see Appendix
C.
Step 4: Starting
the Ground station.
The ground
station software is what you will mainly
be using to communicate
with the Crazyflie. It has been pre installed and set up on the virtual machine for this
lab.
You need to know the channel
that a Crazyflie is connected to. Here is a sheet that lists the
channels of each drone. Crazyflie Radio Map.
To connect to a Crazyflie and open the GUI, make sure the Crazyflie is powered on and the crazyradio
is available in the vm, then run the command crazycart <radio_channel>. If everything connects successfully, the GUI will open. Below
are some details
on how to perform tasks in
the GUI.
Step 5: Connect to the
backend
You will need to verify that the GUI connected to the backend
every time
1. Navigate to the backend
tab
2.
Verify text box says ./BackEnd
3. Verify the connect button
has been clicked
(to connect the test stand
to the GUI is also on this tab)

Figure 5. Connect Backend
Step 6: Get/Set Parameters
Lets you view and set parameters of the Crazyflie
1.
After connecting to the backend,
navigate to the param tab
2.
The top half lets you view the parameter values
of the Crazyflie while the bottom half lets you set those same
parameters
3.
You first have to
select the group that the parameter is part of then you can
select a specific parameter in that group
a.
Alternatively, the key parameters used in MP-4 can be quickly set by altering
a JSON file. Open ‘~/Desktop/groundstation/mp-4Params.json’ and fill in the file with
valid values. Next,
press the ‘Set Param from JSON file’ button and wait a few
seconds. The ‘Complete’ text will darken once the list of parameters is set.
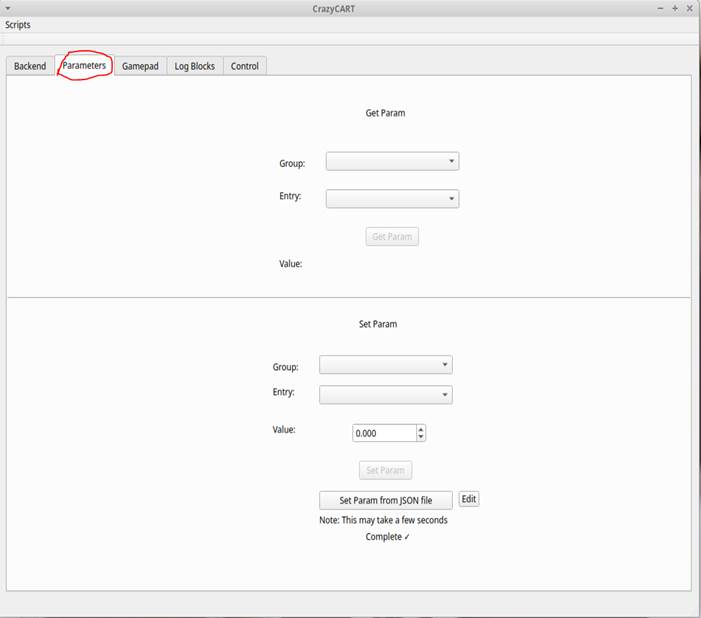
Figure 6: Parameters Tab
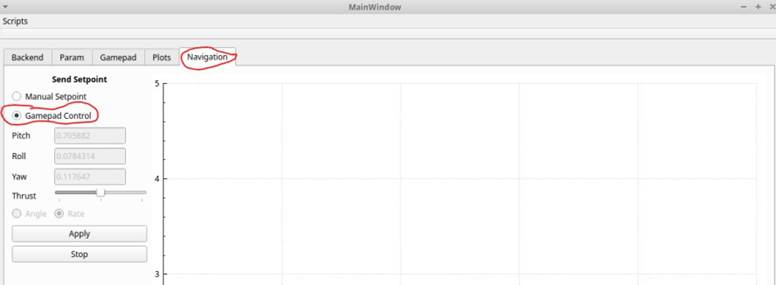
Step 7: Sending setpoints
Sends setpoints to the drone
1.
Navigate to the control tab
2.
Make sure manual
setpoint is selected
3.
You can enter desired pitch/roll/yaw and slide the thrust in the boxes
below
4.
You then chose if you want to send a rate or angle setpoint
then click apply to send it
5.
Clicking stop will send a stop setpoint
(all inputs 0) to the drone
Figure 7: Manual Setpoints
Step 8: Graphing Log Variables
Log variables
are the main form of feedback and debugging used in this lab. They will be used
to tune PID values and debug code.
1.
See Adding New Logging Variables if needed
2.
With the crazyflie connected, navigate to the Control tab
3.
In the side bar you can specify
up to 5 variables from active logging blocks to plot on
the right
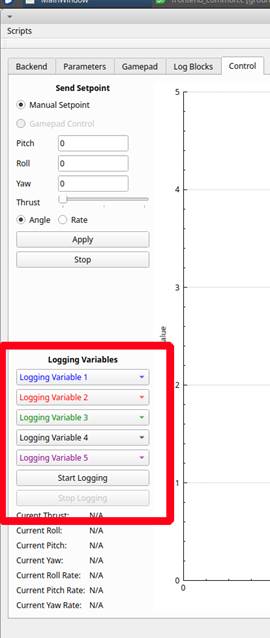
Figure 8. Logging variables
4.
Once variables are selected click start logging
to capturing data
5.
Press the stop logging button
when you are done capturing
data.
6.
The data will be displayed
in close to real time. After plotting
has stopped you can zoom in
and move around the graph.
7.
If nothing is plotted after clicking start logging, refreshing the log block can help, see Adding New Logging Variables
Part 1: Tuning the PID Controller
PID control
utilizes a measurement of state of a system, and the comparison of that
measurement with a setpoint to determine an error value. By multiplying, integrating or observing
the slope of this error a PID controller can be developed. The drone uses a series
of nested PID controllers to control yaw, pitch
and roll, both as attitude rates and attitude. Each rate, or attitude axis
requires Kp, Ki and Kd
values to act as the coefficients for the PID controller. Your goal for part 1
of the lab is to find Kp, Ki and Kd
values for each of these controllers that enable robust control of the
quadcopter. The values you choose will be driven by: 1) your observations of
the quadcopter's response to changing setpoints, and 2) your intuitive understanding for how each coefficient should
mathematically impact the quadcopter's
response. It may be helpful
to read Using the Test Stand for background information on how to utilize it while tuning.
Tip: Begin with Kp,
and then move to Kd values before Ki. When adjusting
values, try first to adjust by an order of magnitude (multiply or divide by 10)
before making smaller adjustments. Many Ki values
can stay as very small
or zero. Not all PID’s
require all or even two coefficients
to be non zero. In general Ki values are used to improve the disturbance within
the system. Since we
are tuning the system with a low disturbance factor
the Ki values do not need to be large.
Attitude Rate Control
We will begin by tuning the attitude rate controller. This controls the rate of rotation of the yaw pitch and roll.
Tip: When tuning your rate controller,
allow for a “looser” control. In other terms, the percent overshoot and settling time can be a bit larger than typically desired.
This allows us to
tune the attitude controller “tighter” later. As the attitude PIDs and rate PIDs have somewhat competing goals, there is a limit to how
tightly both can be simultaneously tuned.
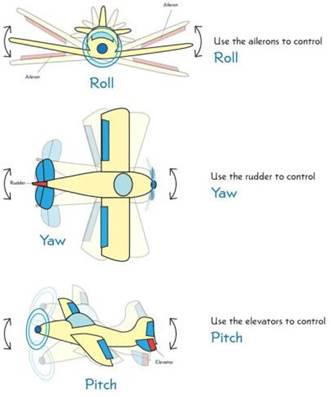
Figure 9: Roll, Yaw and Pitch Diagram
(source)
Step 1: Yaw Rate
First you will
learn how to measure yaw rate with the test stand. Put the test stand so that
it is standing with the three legs on the ground with the attachment that will hold the drone parallel to the ground, as figure 10 shows.
Figure 10: Yaw rate test stand
setup
Now, connect to
the Crazyflie and open the groundstation
GUI. We will be graphing the test stand rotation rate and the yaw attitude
rate setpoint. Details
on how to use the test stand and
how to set up plotting can be found in Appendix C.
You can now send
yaw rate setpoints and thrust setpoints via the ground station which will tell
the Crazyflie to rotate at a certain
speed, the test stand sensor
will then measure
the actual rate and display that on the GUI. However,
with no PID constants set, the Crazyflie will not
respond to setpoints. Your task is to change these constants through the GUI by
setting parameters.
Relevant logging variables:
● MicroCART.Test_stand
○
This is the test stand
data
●
ctrlStdnt.yawRate
○
This is the yaw rate
setpoint
● Optional - ctrlStdnt.r_yaw
○
This is the crazyflie’s on-board sensor
for yaw rate measurements
Be sure to write down the PID values
you find while tuning! They will be used in the second half
of the lab and are required for submission. Also, the PID values are reset when
the Crazyflie reboots, so be sure to write them down
frequently! Additionally, there is a
option to save your values through the use of a .json
file. This is especially helpful to keep your PID value.
Relevant parameters:
Group:
s_pid_rate
●
yaw_kp
●
yaw_ki
●
yaw_kd
Tip: If the ground station becomes
unresponsive or stops sending setpoints to the crazyflie,
stop it by pressing ctrl + c in the terminal you launched it and restart it.
The PID constants are stored in the crazyflie’s memory so they should be unchanged, unless the quadcopter is power cycled.
Your goal for this
part of the lab is to demonstrate that
you can send a yaw rate
setpoint to the Crazyflie and then verify
through the GUI ground station
that the Crazyflie follows
that setpoint closely.
Step 2: Pitch Rate
Now change
the mount attachment so that the Crazyflie will be held vertically and the left or
right side of the drone is facing the table, as shown in figure 11.
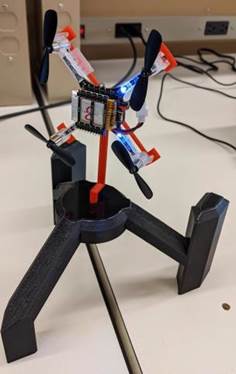
Figure 11: Pitch rate test stand setup
You will now be tuning
pitch rate,
this is how fast the Crazyflie tilts up or down. Repeat the process you did for tuning the yaw rate,
but with the appropriate pitch rate parameters and logging values.
Note: The e_stop parameter under the sys group should
be set to 0. The e_stop, electronic
stop, is a safety feature which turns off the quadcopter if it flips. Setting
the e_stop to 0 will prevent the crazyflie
from automatically rebooting when it detects tumbling.
Relevant logging variables:
●
MicroCART.Test_stand
○
This is test stand
data
●
ctrlStdnt.pitchRate
○
This is the pitch rate setpoint
●
Optional
○
ctrlStdnt.r_pitch
■
This is the crazyflie’s on-board sensor
for pitch rate measurements
Relevant parameters:
Group:
s_pid_rate
●
pitch_kp
●
pitch_ki
●
pitch_kd
Step 3: Roll Rate
Change the orientation of the drone so that the front
or back is facing the
table.
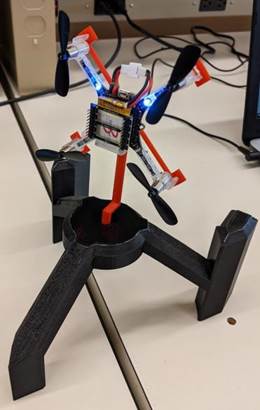
Figure 12: Roll rate test stand setup
You will now be tuning roll rate, which is how fast the Crazyflie tilts to the side. Repeat the process you did for tuning the yaw
rate and pitch rate, but with the appropriate roll rate parameters and logging
values.
Remember to set the e_stop parameter under the sys group to 0
Relevant logging variables:
●
MicroCART.Test_stand
○
This is test stand
data
●
ctrlStdnt.rollRate
○
This is the roll rate setpoint
●
Optional - ctrlStdnt.r_roll
○
This is the crazyflie’s on-board sensor
for roll rate measurements
Relevant parameters:
Group:
s_pid_rate
●
roll_kp
●
roll_ki
●
roll_kd
Attitude Position Control
We will now tune how the Crazyflie holds a specific attitude
angle. Recall from Figure 3 that the attitude PID controller provides the
input setpoint to the attitude rate controller. Therefore, it is
important that the rate controller works well and all attitude
rate PID values
are set before continuing.
Step 4: Yaw Attitude
Change the test stand setup to how you measured yaw rate. You will now be
tuning yaw, which is the angle that
the Crazyflie is oriented. This is done similarly to
yaw rate except you will be sending degrees rather than degrees per second
setpoints. Note, there is a button built into the test stand for setting the 0
point of rotation, this can be used to approximately sync up the test stand
angle measurement with the Crazyflie’s built-in
measurement. In the end you will demonstrate
that you can make the Crazyflie rotate to and hold a specific
yaw angle, confirming it through the GUI ground
station.
Relevant logging variables:
● MicroCART.Test_stand
○
This is test stand
data
●
ctrlStdnt.yaw
○
This is the yaw
setpoint
●
Optional - stateEstimate.yaw
○
This is the crazyflie’s state estimator for yaw angle
Relevant parameters:
Group:
s_pid_attitude
●
yaw_kp
●
yaw_ki
●
yaw_kd
Step 5: Pitch Attitude
For this part of the lab we will turn the test stand on its side and attach the other mount that will hold
the Crazyflie parallel
to the floor. Ensure the left or right side of the drone is facing the test
stand, as shown in figure 13.

Figure 13: Pitch test stand setup
Repeat the process you did for tuning the yaw, but with the appropriate pitch parameters and logging values. You will demonstrate
that you can make the Crazyflie rotate to and hold a
specific pitch angle, confirming it through the GUI ground station.
Remember to set the e_stop parameter
under the sys group to 0
Relevant logging variables:
- MicroCART.Test_stand
- This is test stand data
- ctrlStdnt.pitch
-
This is the pitch setpoint
- Optional - stateEstimate.pitch
- This is the crazyflie’s state estimator for pitch angle
Relevant parameters:
Group:
s_pid_attitude
●
pitch_kp
●
pitch_ki
●
pitch_kd
Step 6: Roll Attitude
To measure
the roll you will turn the drone 90 degrees
such that the back or front of the drone is
facing the test stand, as figure 14 shows.
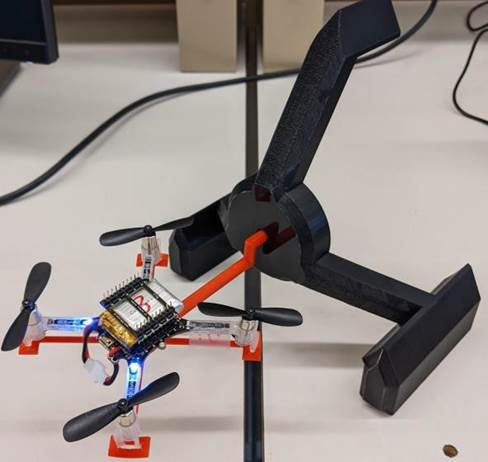
Figure 14: Roll test stand setup
Repeat the
process you did for tuning the yaw and pitch, but with the appropriate roll
parameters and logging
values. You will demonstrate that you can make the Crazyflie rotate to and hold a specific roll angle,
confirming it through the GUI ground station.
Remember to set the e_stop parameter
under the sys group to 0
Relevant logging variables:
- MicroCART.Test_stand - This is test stand data
- ctrlStdnt.roll - This is the roll setpoint
- Optional - stateEstimate.roll - This is the crazyflie’s state estimator for roll angle
Relevant parameters:
Group:
s_pid_attitude
●
roll_kp
●
roll_ki
●
roll_kd
Step 7: Maiden Voyage.
Now you are ready to test how well your PID values work in flight.
You will be fine tuning your
values through test flights!
At this point you should be able to fully control
all axes of the drone through a gamepad. Before you take off for real, it's always a
good idea to check that your inputs do what you think they do
while on the test stand. Gamepad control uses a mixed setpoint setup where
pitch and roll are given as absolute angles, and yaw is given as a rate. Once
everything looks ok on the test stand, carefully
try to take off and get a feel
for how she handles. Enable estop by setting the
parameter to “1” before flying off the test
stand. Be aware of others
in the lab and try not to crash it
too hard.
Step 7a: Gamepad
Control
Control Crazyflie with gamepad: This video can also be used as an example.
1.
Be sure to pass the usb gamepad to the VM by clicking
the USB symbol in the bottom
right of the window and selecting the gamepad
2. Navigate to the Gamepad
tab
3.
The provided gamepad
should be configured already, if not you
can click the configure tab then move the joystick to the max and min value to
calibrate it
Tip: It may be useful
to add a negative to the scales
of the axes in order to
invert joystick controls.
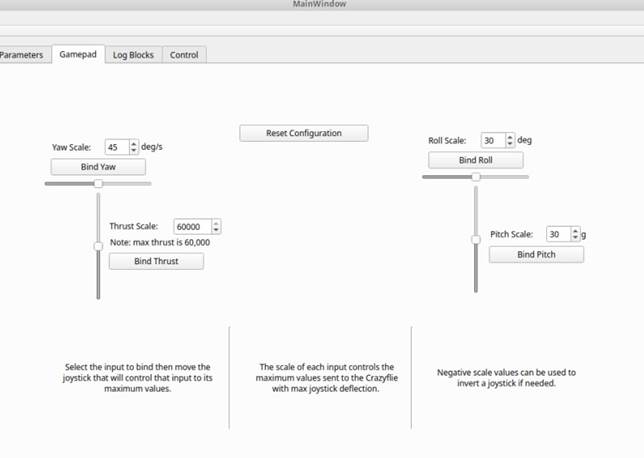
Figure 15: Gamepad Menu
4. Navigate
to the control tab and select the gamepad control button after you have plugged in your controller. The ground station will immediately start sending setpoints
to the crazyflie. The thrust joystick should be held to zero when switching to
gamepad control to avoid unexpected takeoffs.
Figure 16: Gamepad Selection
Part 2: Understanding the controller.
For this part of
the lab you will be writing your own control
algorithms. Be sure to set up code exporting from
the VM so you don’t lose your work. The virtual
machines are all immutable, which means that if you do not save your work elsewhere it will be deleted at reboot. All locations where you
will need to write new code have been commented with 488 TODO. You can use VS code’s built-in
search function to find all occurrences to make sure you
haven’t missed anything.
*Make sure to flash the drone with lab part2’s
firmware.* Flashing the drone
Background
Before beginning, it is recommended to read through
the files you will be changing and the
corresponding data structures.
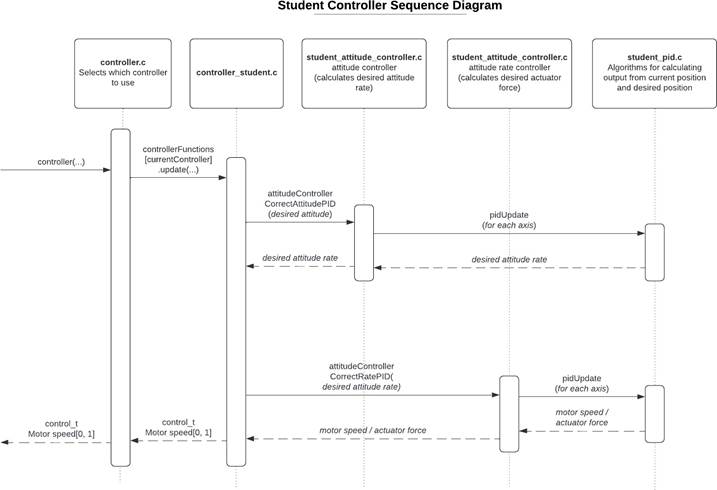
Background: Controller Layout
The high level student controller, defined in controller_student.c, manages setting up setpoints and forwarding them to the
attitude controller, whose output gets fed into the attitude rate controller.
Both the attitude and attitude rate controller are defined in student_attitude_controller.c. The attitude
and attitude rate controller utilize
the base pid
algorithms defined in student_pid.c. The output from
the attitude rate controller gets
passed back to the high level student
controller where it then gets forwarded to other modules outside the scope of this lab.
Figure 17: Student Controller Sequence Diagram
Background:
Understanding the Code
As a part of writing your own algorithms, it is important
to understand the data structures used in the firmware.
Additionally, it can be useful to specify what logging information to send to
the ground station. Below are details on both subjects which will help in the
development of your algorithms. Additionally there are
some further details on compiling the Crazyflie
firmware below.
Background: Data Structures
There are four main structs that you will have to be familiar
with that the state controller uses to communicate with other modules
defined in the /src/modules/interface/stabilizer_types.h file. A small but
important struct is the attitude struct, containing roll, pitch, and yaw values
as floats and has a timestamp. Depending on the control context (viewable in
the setpoint.mode struct)
the values in this struct can represent degrees, or degrees per second for each
axis.

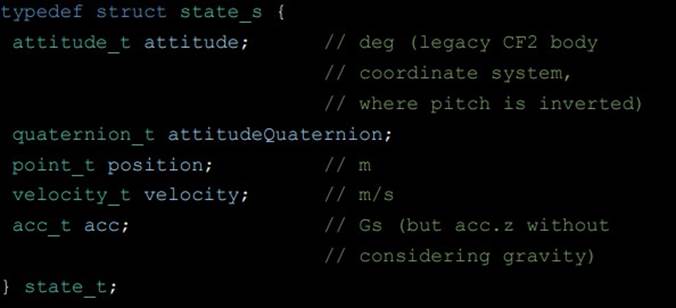
Figure 18: Attitude struct
The first main
struct is the state struct: it contains Crazyflie's
current attitude and other parameters not relevant
to this lab. Note that the current
attitude rate is not available in the state struct. For this value you will need to read directly from the gyroscope described in the sensorData struct.
Figure 19: State struct
The sensor data struct contains
raw data from several sensors,
including the gyroscope. You will need to access information contained in this struct for some of your rate PID calculations.
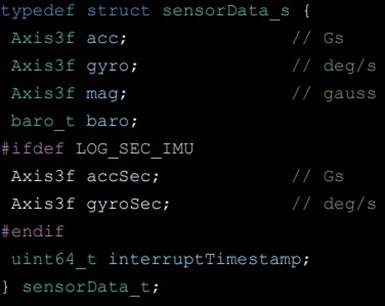
Figure 20: Sensor data struct
The next major
struct that you will interact with is the setpoint struct. The struct contains
the setpoint information from the commander module which received setpoints
from the ground station. Similar to other structs, it
contains many fields of information you do not have to worry about. The
important fields are attitude, attitude
rate, and thrust. The others like velocity and acceleration are not used because you will be implementing an attitude controller, not a position or velocity controller.
Additionally, the
mode struct controls how the data in the setpoint
struct is interpreted. The modes are set automatically by the ground station based on the control method.
For this lab, we
are concerned with only two or three control modes, attitude control, attitude
rate control, and mixed attitude control.
Background: Control Modes
Attitude control If:
●
setpoint.mode.x y and z are set to modeDisable
● AND
●
setpoint.mode. roll pitch and yaw are set to modeAbs
Then, the controller will use the values given by setpoint.attitude.
Attitude rate control If:
●
setpoint.mode.x y and z are set to modeDisable
●
AND
● setpoint.mode. roll pitch and yaw are set to modeVelocity
The controller
will use the values given by setpoint.attitudeRate.
This mode ignores most of the control algorithm and only uses the attitude
rate controller to stabilize and control the quad. This mode is useful if you want to hold a
steady rotation speed of the quad body, this is what some other quads call
“acro mode”.
Mixed Attitude control If
●
setpoint.mode.x y and z are set to modeDisable
● AND
●
setpoint.mode. roll and pitch are set to modeAbs and setpoint.mode.yaw is set to
modeVelocity
This allows the roll and pitch to be specified as a rate and the yaw to be an angle. This is the method used when a gamepad controller
is used.

Figure 21: Setpoint Struct
The last struct
is the control struct. This is the output of your control algorithm and
represents the force to apply to the drone’s
body. It is sent to the power distribution module which converts it into motor commands. Note that these are 16
bit int values, so a conversion must take place from a float.
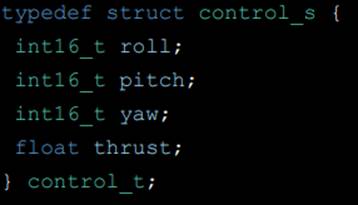
Figure 22: Control struct
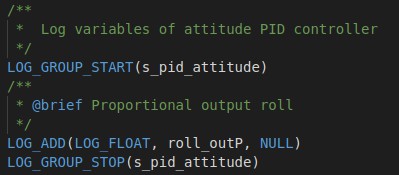
Background: Logging
Instructions
1.
At the bottom
of the controller_student.c and student_attitude_controller.c you will see a list of log commands. It should look
like this in structure but with many more LOG_ADD commands and a couple of
groups.
Figure 23: Sample Log Group
2.
This is how information is communicated to the ground
station such as current yaw, pitch, roll and other information
3.
In the spot currently NULL you will put a pointer to the address
of the global variable you want to log (ex: you have named your
output pitch variable outPitch, you would put &outPitch in the field and it would look like the following)
Figure 24: Sample Log Add
4. Now you know how to send information to the GUI ground station
:)
5.
The parameter macros
below the logging
are how the GUI sets constants in the
firmware, like you did with the PID constants in part 1.
6.
Some of the controllers used in part 2 will not function
correctly without logging
actual values. Ensure that all addresses inserted are not null.
Background: Compiling
The Crazyflie Firmware
The crazyflie firmware can be compiled from the firmware
root folder,
/Lab_Part_2/crazyflie_software/crazyflie-firmware-2021.06/ by
running make CONTROLLER=”Student”. After successful compilation, the binary files will be placed in the root
of the firmware folder and can then be flashed
to the crazyflie by following the instructions
above.
make unit can also be used to run unit tests on the firmware, the unit tests are defined
in
/Lab_Part_2/crazyflie_software/crazyflie-firmware-2021.06/test/. You are free to add additional unit tests to debug, however
it is not required.
Writing the controller code.
Now that you
understand the structure of the firmware, it's time to
start writing your own algorithms. You may want to review Flashing
the Crazyflie, when you’re ready to compile run make CONTROLLER="Student" from the root of the Crazyflie firmware.
Below
is the suggested order of additions to make
to the firmware.
Step 1: General
PID
Note, for this section
you should use the PID constants you found in part 1 for known good values.
You can set the default values in the student_pid.h file.
However the constants you discovered earlier may have
some assumptions built in so it may
be necessary to re-tune the controller if a significantly different algorithm
is used.
1.
The first thing
that you will write is a general PID
function and struct. The PID struct that we
provide you will be empty and you will decide on what should be included in it, that is
defined in student_pid.h. You are encouraged to make
as many helper functions that you would like in your student_pid.c
file to help with roll, pitch and yaw calculations.
2.
The first thing I would recommend writing is the PidObject struct in student_pid.h. This struct is
used to hold the data that is used for all other PID calculations so it is
required to write many of the other functions.
3. Next, write the basic getters and setters for the PidObject in student_pid.c.
4.
Now we can actually write the PID algorithm
in the studentPidUpdate
function.
5.
At this point,
you should have filled out everything in student_pid.c and student_pid.h, make sure all of the “488 TODO” comments have been fulfilled in these files.
Step 2: Student Attitude
Controller
The attitude controller and attitude rate controller have their main functions in
student_attitude_controller.c, this is where you should
begin working.
1.
Complete the initialization function for the attitude controller.
2.
Implement the student
attitude rate controller PID.
3. Test rate controller
4.
Next, write the student attitude
controller PID.
5. Test attitude
controller
6.
Then finish the reset PID value helper
functions
7.
Finally, fill in the logging
parameter addresses. Then make sure all of the “488 TODO” comments have been fulfilled in
these files.
Step 3: Student
Controller, Bringing it all together
Now we need to bring everything together in the controller_student.c file.
1.
Start by reading in the setpoints for roll, pitch and yaw angles as desired values. For mixed attitude
mode, the yaw angle should
change from the current angle based on the
rate given. Also, set the desired thrust.
2. Use
the attitude PID controller to set the desired attitude rate to the value
calculated. If the controller is in velocity
mode, overwrite the attitude rates
with the setpoints provided.
3.
Next, input the desired attitude
rates into the PID controller and use the outputs to set
the command variables for roll, pitch, and yaw. Set the output thrust.
4. Copy the values into separate variables
for logging purposes.
5.
Complete the logging
parameters by filling
in the addresses.
At this point, you should have filled out everything
in all files, make sure all of the
“488 TODO” comments
have been fulfilled.
Step 4: Final Check
Before you go
flying your Crazyflie for real, it's
a good idea to verify everything works as intended on the test stand. Attach
the drone to the test stand and briefly check that all axes respond how you expect. For this step you can use manual
setpoints or a gamepad connected to the ground station, see here
for details on using a gamepad with the ground station.
If all looks good, take her for a spin and see how she handles! Be careful of others
in the lab and try not to crash it too hard!
What to submit:
●
Kp, Ki, and Kd constants for yaw rate, pitch rate,
roll rate, yaw, pitch, and roll
●
All documents that were edited in the firmware to complete
part 2, see final export for details If you’re hungry
for further challenges, take a look at the extra credit
section of this lab.
BONUS credit.
1. Give feedback
on this lab (+5 points)
a.
This is a new lab developed by the MicroCART team as a senior design
project. We would appreciate some feedback on what you enjoyed about the
lab and what can be improved.
b. Google Form Link
2.
Test Stand Data Visualization (+10 points)
a.
As in MP-1,
extra credit may be awarded
to teams that make a creative
visualization for the test stand position or rate data.
3. Manual flight
obstacle course (+5 points)
a.
If teams can demonstrate their stable control algorithm
by manually flying through an obstacle
course extra points can be awarded.
Film your obstacle
runs and submit.
4.
Autonomous flight (+10 points)
a.
The Crazyflie has many
autonomous capabilities that we have not even touched in this lab. Extra credit will be awarded
if you can write a short script
to takeoff, fly to some xyz
coordinates using a positioning system. If you are interested, talk to your TA
about setting up the positioning system in the lab.
b. You could write a short script that uses the
ground station CLI to send commands over and over or you could
use the crazyflie python
library to send high level commands to the Crazyflie.
i.
An additional circuit board, the flow deck, or
the lighthouse deck is required to use the crazyflie python
library. If you wish to pursue this, talk
to a TA and they can acquire a flow deck from the MicroCART
team (microcart-f2021@iastate.edu).
ii.
A test stand that has been made for the purpose of tuning a positional
controller has been made to assist with this task should you use the lighthouse
deck. Ask your TA for more information.
iii.
Details on writing python scripts for the crazyflie can be found on the MICROCart seniors
design team git repo. Talk to your TA for more details
Appendix A
The Crazyflie is a versatile, open source
quadcopter platform by Bitcraze. The platform has
been specially adapted
to meet the needs of this lab but has far more capabilities. If interested
in exploring the platform further, check out their website here.
Crazyflie Status Sheet
The current status of quadcopters and their radio channel can be found at Crazyflie Radio Map.
Crazyflie LED Codes
One of the main ways the Crazyflie communicates its status is with
the four LEDs mounted to the surface.
|
LED code
|
Meaning
|
|
2 solid BLUE
|
All normal, indicates the
back of the Crazyflie
|
|
2 Slow flashing BLUE (1 hz)
|
Crazyflie is in bootloader mode and is ready
to be flashed by radio
|
|
1 Fast flashing BLUE (2 hz)
|
Crazyflie is in DFU
mode and is ready to be
flashed by USB
|
|
Back left BLUE flashing
|
Charging while plugged
into USB. Percentage of time LED is on indicates
battery level.
|
|
1 slow flashing RED (0.5 hz)
|
Crazyflie is on but sensors are
not calibrated. Place on a
flat surface and keep still to calibrate
|
|
1 fast flashing RED
(2 hz)
|
Sensors are calibrated and ready to fly
|
|
5 short RED pulses followed by a gap
|
Self test failed, hardware may
be damaged, notify a TA or
the instructor
|
|
1 solid RED
|
Low battery
|
|
5 short GREEN pulses
|
Self test passed, all
normal
|
Appendix B
Virtual Machine Details
The virtual
machine has been configured to have the necessary utilities to develop the Crazyflie firmware. Below are detailed instructions for
completing different tasks within the virtual machine. Login username is bitcraze and password is crazyflie.
Adding the Virtual
Machine Instance
The virtual
machine is installed
on the lab computers as an immutable
virtual machine. To access it you may need to add it to the
virtual box. Click “Add” and navigate to C:/Temp/MP4Image/BaseFolder and click
the vbox file. The virtual machine should now
be available.
Importing the Virtual
Machine Instance
Other than using
a vbox file, users are also able to
import ova instances to get the VM instantiated inside of VirtualBox. Things
may be prone to going wrong with the VMs (typically finding them reaching an
invalid state). If an ova file is available to use, below are the
following steps to import the virtual machine ova:
New
users will not be able to see the VM instance until it is imported.
1.
Open Virtual box application
2. Go to Import
3.
Navigate to the VM installation, <path-to-ova-file>
4. Open the .ova file.
Navigate to “finish” and wait. This process may take a few minutes.
5.
The virtual machine
should now be available.
Folder Sharing with the Virtual
Machine
Go to VM settings, machine → settings
then shared folders
On the far right
click the blue folder with a green cross to add a new shared folder
Set the folder path to a folder on the windows
system to share with the VM
Select Auto-mount
For the mount point
enter ‘/home/bitcraze/shared-folder’ or some other specified mount point
Select make permanent
This option is only available while the vm is running
Select ok on both dialog boxes to complete
the shared folder
setup
You should
now be able to navigate
to /home/bitcraze/shared-folder in the VM and see the files in your shared
folder
Exporting Code From the Virtual Machine
Due to the read only VM image, you must export your work from the VM before shutting down. The VM will be reset on
reboot and all changes will be reverted.
There are two options
to maintain and export your changes from the virtual
machine. The first is
to use a local git repository stored on your
x drive or a usb flash drive. This minimizes
network usage. The second option is to use a standard GitHub or GitLab
repository. This option is best for working with other people in your group at
the same time. If you do use the second option we ask
you make your repo private.
With a bare git repository on the
host machine
Create a bare repository on your x drive or a removable media device ‘git init --bare my_repo_name.git’
This will create a folder called my_repo_name.git with no working tree.
Share this folder with the VM and mount it at ‘/home/bitcraze/transfer-
repo.git‘,
see details on sharing a
folder with the VM
Once the bare
repository is accessible from within the VM, the Microcart
repository should already be setup to use ‘/home/bitcraze/transfer-repo.git’ as a remote, check this with ‘git
remote -v’
Commit and push your changes
to your shared folder
If this fails
try setting the remote url again with ‘git remote set-url origin <absolute path to shared
folder>’
Your changes
will now be on the bare
repo in your shared folder,
these changes can now be reapplied later
This can be
verified by navigating to ‘/home/bitcraze/transfer-repo.git’ and running git log Lab_Part_2
With normal GitHub/GitLab repository
Note: the first commit
may take a while as all the git history must be
uploaded
Create a new private blank
repo on github or gitlab, obtain the url or ssh address to the repo
In the Lab_Part_* folder run ‘git remote
set-url origin <address of remote repo>’
Note this set-url command must be run each time the VM is
rebooted due to the immutable hard drive setup
Commit and push your changes as normal
Importing Work Into the Virtual Machine
With a bare
git repository on the
host machine
Ensure the bare repository is accessible within
the VM, see details on sharing a folder with the VM, mount it at ‘/home/bitcraze/transfer-
repo.git’
The Microcart repo should already
be setup to use
‘/home/bitcraze/transfer-repo.git’ as a remote From
within the Lab_Part_* folder run ‘git pull’
With normal GitHub/GitLab repository
Set the remote repository with ‘git remote
set-url origin <address of remote repo>’
From within the Lab_Part_* folder run ‘git pull’
Final export from the virtual
machine
Final export
will copy all files that have been modified since the original
state of the Microcart repo.
Ensure folder sharing and your git repository are setup correctly Commit all changes within the
git repository to be exported
From the root of the Lab_Part_2 folder, Run ‘cp -pv --parents $(git diff Lab_Part_2_tag --name-only) <DESTINATION-DIRECTORY>’
The destination should
be a shared folder other than your transfer
repo
so the files are accessible from the host machine
This will copy all modified files since the Lab_Part_2_tag into the
destination directory
Troubleshooting the virtual machine
The virtual
machine is prone to having some issues when it comes to the stages between
downloading, implementing, and use. The following section details the most
reported issues in previous years, and how to properly address and fix them.
“The
virtual machine is not seeming very responsive and is laggy.”
After importing
the virtual machine, make sure to check that:
·
The version of the virtual machine matches the
version described and provided in lab.
·
Make sure that the processor and memory settings
are set to max utilization.
To check this,
head on over to VirtualBox and right click your virtual machine on the side.
Select “Settings” and navigate your way to the “System” tab. There, you should
be able to access slides used for setting the amount allocated to the virtual
machine.
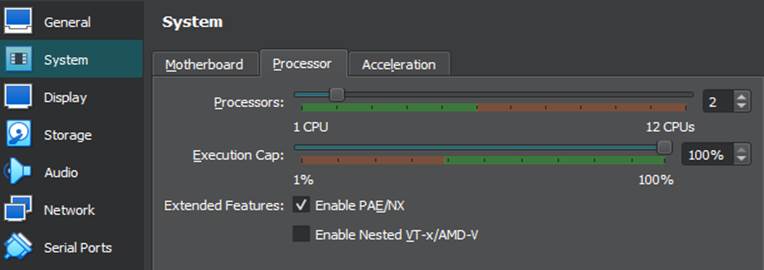
Figure 25: System sidebar menu in VirtualBox
“There’s lots of small error icons floating around when I open my
virtual machine.”
We’ve run into a couple issues in the past where exporting and reimporting
virtual machines and somehow corrupt parts of the ova file. In some rare cases,
VirtualBox will flood the screen with errors, preventing students from
accessing the lab content.
To
fix this, navigate to the top of the top of the virtual machine while opened,
and select the “Devices” tab. Then, click “Upgrade Guest Additions” and let the
virtual machine run this process. This might take several minutes.
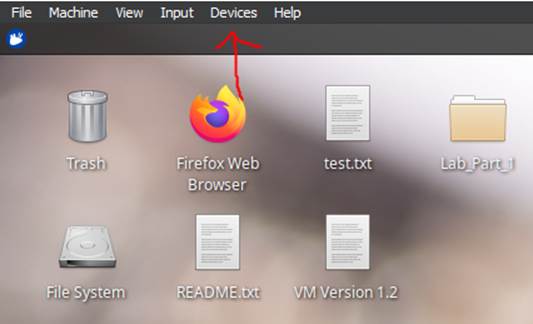
Figure 26: “Devices” location in virtual machine
“I am having frequent issues with getting my USB Crazyradio
dongle connected.”
There
could be several causes to these issues, including faulty hardware, bad USB
drivers, and other hard to spot factors. Luckily, we can check to make sure
that our virtual machine isn’t producing these issues.
Head
on over to your USB settings (either inside or outside of the virtual machine)
by navigating to Devices → USB → ”USB
Settings”. Remove all of your current USB Device
filters and remake a new one for your Crazyradio
dongle. Then, Change your USB Controller version to
2.0, and give the virtual machine a reset. Then, try reconnecting your hardware
and give it a few attempts after 10-15 seconds to test for connectivity. If
issues persist, be sure to reach out to a TA or leave a message on the class
Discord.
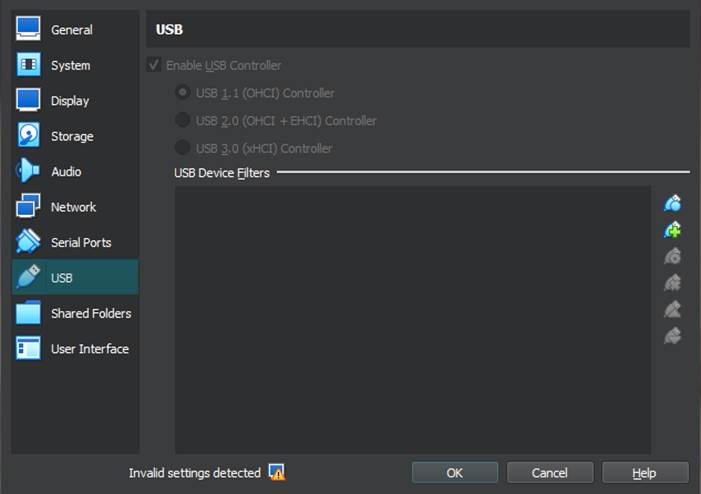
Figure 27: USB Settings Manager
The VirtualBox virtual machines are managed each year by the MicroCART Senior Design team. These are frequently tested
and updated to fit the new releases of the MP-4 lab designed. As more changes
are made, more error are bound to occur. Please be
sure to notify the 488 TAs and MicroCART team of any
other new issues that might occur to the Virtual Machine, as they will work to
address these changes and push the newest, stable release as soon as possible.
Appendix C
The test stand control
board reads the rotary encoder
value, and transmits
either positional or rotation rate data to the computer.
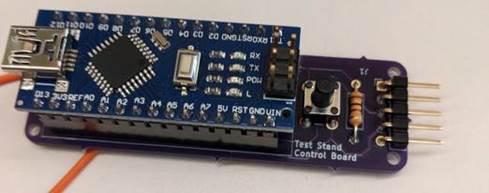
Figure 28: Test Stand Control Board
Utilizing the Test Stand
1. Start the Crazyflie drone on a flat surface before
you attach it to the desired mount
2.
Attach the drone to the mount by inserting each pair of
clear plastic legs to a corresponding slot in the mount.
If you’re using the vertical
drone mount, make sure that the drone is mounted appropriately to
measure either pitch or roll
3.
Once the drone is mounted,
insert the shaft of the mount into the hole on the top of the
test stand base, making sure it fits snugly and doesn’t
rub against the sides.
4.
Plug the small three pin end of the gray cable into the rotary encoder. While you are able
to only insert the plug in the correct orientation, please do not force
the plug if you are met with resistance. Both the cable and the rotary encoder
are fairly expensive, and we have limited replacements
5.
Plug the other end of the gray cable into the 5 pin connector on the test stand control board. Make sure
to pay attention to the orientation of the connector, since this end of the
cable can be plugged in backwards, although doing so shouldn’t
harm anything. Make sure that the black wire on the cable connects
to the connector pin with the square solder pad.
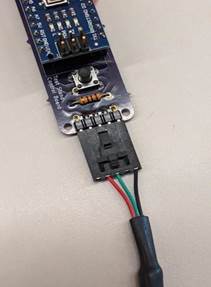
Figure 29: Test Stand Connection
6.
Finally, connect the Arduino Nano to your PC using a mini USB cable and press the
“Connect Test Stand” button on the GUI.
Using the Test
Stand
The test stand
has two modes, where it reports either positional data or the rotation rate (in
deg/sec). The LED labeled “L” on the Arduino Nano is used as a mode indicator,
and is on when the control board is in
position mode, and off when in rate mode. You can switch between modes by pressing and holding the black pushbutton
mounted to the control board PCB. Additionally, the black pushbutton is
used in positional mode to zero the reported reading (sort of like “tare” on a
digital scale). Short pressing the
button while in positional mode will reset the reading
to treat the drone’s current
position as zero. While you will be
able to see the reported data in the GUI, you can read the data reported by the
controller by connecting to its COM port with PuTTY (or similar) at a baud rate
of 9600.
Appendix D
Operating the Ground
Station
The Ground
Station can be opened using
the command crazycart <radio number>
using the
radio number corresponding to your quadcopter.
Adding New Logging
Variables
The crazyflie uses what are called “Log Blocks”
to define what variables are logged and sent to the ground station. A log block
specifies what values to send and at what rate. Log blocks can be paused and
resumed after initial setup. Note the crazyflie
communication has a limited bandwidth, only
enabling around 10 logging variables at a time.
1.
Navigate to the Log Blocks tab
Figure 30: Log Blocks Tab
2.
The list on the left shows all available logging
variables from the Crazyflie firmware
3.
To view and modify what logging variables are sent, click the “Open
Logging Block Setup File”
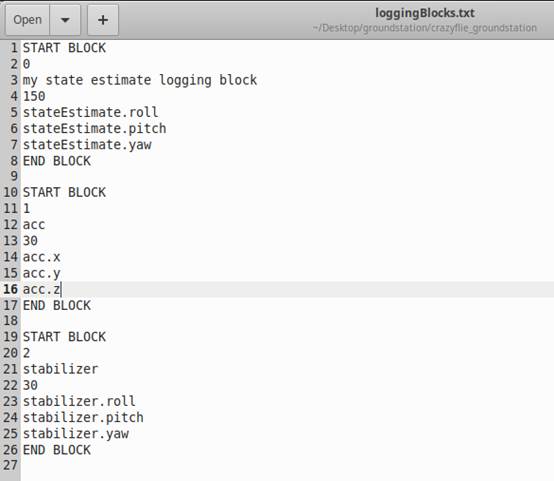
Figure 31: Logging Blocks
File
a.
The logging blocks
have a defined format that must be
followed
i.
A block definition starts with START BLOCK
ii.
The next line is the logging block integer id,
it must be unique to other logging blocks defined
iii.
The next line is the name of the logging block,
this can be any string you’d like
iv.
The next line is an integer defining the rate of the logging block, a higher
number pushes more data to the ground
station. Note, too high of a rate can overload the graphing
visualization and cause the GUI to slow down. Safe values are below 100.
v.
The following lines define the variables that are in the logging
block, these are defined by the firmware and can be viewed in the large list
mentioned above. Any number of variables can be in the log block and they do not have to be from the same
logging group.
vi.
A block definition ends with END BLOCK
vii.
Any lines that are outside
of a block definition are ignored
4. Save and close the logging block definition file
5. Click Refresh Log Blocks to
send the new definition file to the crazyflie
6.
The drop down on the right should now show your new logging block and will be active
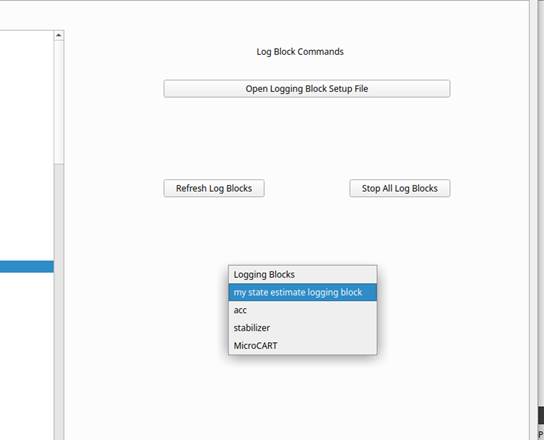
Figure 32: Log Block
Commands
7.
If needed, you can increase
available bandwidth during logging by pausing all other log blocks, selecting your new one from
the drop down, and resuming it.
a.
The stop all log blocks
removes the log blocks from the Crazyflie. You will need to pause each log block one by one
Changing CrazyCart Logging Rate
If your logging process is
starting to slow down quite a significant amount, it may be because the logging
rate allowed in the crazycart application might be
higher than recommended. The recommended amount for logging block updates is
nothing higher than 100.
Refer to the following section of the MicroCART wiki for assistance on changing specific of
logging variables and their rates: https://git.ece.iastate.edu/danc/MicroCART/-/wikis/GUI/GUI
Notice in the example that the
loggingBlocks.txt file has a value of “150” near the top… This value represents
the logging block rate. If issues persist, change this value to a lower number
to ease the load of logging from the frontend.
Command Line Interface (CLI)
The CLI is the base of the communication with the Crazyflie drone.
It can optionally be used for
basic tasks. You shouldn’t need to interact with the
CLI during the course of the lab, but
it can be useful for debugging if something goes wrong. It can be opened by
adding a “nogui” flag to the end of the crazyCART script. crazycart nogui Run commands with ./Cli ...
Further usage details can be found by appending --help to the end of a command.
The following commands are currently implemented.
|
Command
|
Description
|
|
./Cli outputoverride <enable> <Time>
<Throttle> <Pitch> <Roll> <Yaw>
|
output override will send a setpoint that
lasts a set amount of time with the specified throttle, roll
pitch and yaw.
With enable set to
1 it will send the setpoint as a rate and 2 will send the setpoint as an
angle
|
|
./Cli getparam <block_id|’block_name’>
<param_id|’param_name’>
|
Get param will get the value
of specified param. Note only the param
id is used for this command. The param id is found in
the
|
|
|
logging TOC,
use getlogfile 1 command to find this file
|
|
./Cli setparam <block_id|’block_name’>
<param_id|’param_name’> <value>
|
Set param will set the value
of the specified param
|
|
./Cli getlogfile <id>
|
Get log file will
get a certain log specified by the id of
0: data log
1: param id
2: logging toc
|
|
./Cli logblockcommand <id>
|
The log block command
performs specific tasks on
log files for the specified id of
0: delete all log
blocks 1: refresh all
log blocks 2: load log
blocks
3: delete log
block 4: resumelog block 5: pause log block
|
Document Version Changelog
-
Version 1.1
-
Changed optional logging
variables in lab part one from gyro.x, y, z to ctrlStdnt.r_roll,
r_pitch, r_yaw
-
Changed git instructions for vm to use “Lab_Part_* folder” instead
of “Microcart
folder.”
-
Updated student controller sequence diagram to have desired
attitude rate being passed to the attitude rate controller.
-
Removed “Test Stand Control Board
Rate mode” extra credit & replaced it with
test stand visualization extra credit.
-
Version 1.2 (sdmay23-45) Last updated 3/19
-
Reorganized document for readability by adding appendices at the end.
-
Added additional tips to help students progress
through the lab more efficiently.
-
Version 2.0
(sdmay24-32) Last updated 5/6
-
Added more
core information about virtual machines and other VirtualBox logistics.
-
Added logging
block value change section.